Another idea which maybe you find worth of adding : adding something like profiler-only flag to command line , so, while all the functions will be patches and counted as usuall, log will not be writen anything, but only final profiling information.
The profiling is not filtered by pause feature at the moment - you should get the total number of calls at the end. I'm pondering whether it should be. So if you hit the pause, you should still get the profiling results.
Regarding filters, I need to check, can't answer right now.
1). all works (compiles/builds/runs/no_crashes/etc). 2). new added functions for ogles2: glClear,glUseProgram and for Warp3DNova : W3DN_Clear, W3DN_CompileShader, W3DN_BindTexture, W3DN_Submit and W3DN_SetShaderPipeline all traces fine too. 3). Profiling now logs and when quit from gl app, and when quit from glsnoop 4). New "Profile" option save the speed, yeah! I can now play almost without loosing original speed, and profile whole app in any place i need.
Pretty cool :)
Through, found some more new little issues:
1). if you run glsnoop without "PROFILE" key, it say in output "Profiling mode: [disabled]" , while it didn't disabled, it's enabled, just together with tracing. So imho this one should be set as Enabled as it enabled by default together with tracing. Its just when we use only Profiling, should be "Profiling mode: [enalbed]" as it now, and maybe "Tracing mode: [disabled]".
2). if you run glsnoop with "?" to just see help, and then hit "Ctrl+c" (so to not run glSnoop, but exit back to command line), then hit enter, then we have:
Hey guys, great to see glsnoop progressing and becoming an increasingly powerful graphics debugging tool.
A few quick suggestions for the profiler: - It would be useful to print the draw calls/s and draw calls/frame values instead of having to calculate those manually - It might also be worth adding a column for the percentage of total time. It's easy to make the mistake of thinking "wow!" it's spending 80% of its time in DrawElements(), when it's actually 80% of 58.9% spent in the gles2 lib + Nova.
EDIT: Oh, and number of vertices/s and number of primitives/s (triangles/s, points/s, lines/s, etc.) would be useful too.
It might also be worth adding a column for the percentage of total time. It's easy to make the mistake of thinking "wow!" it's spending 80% of its time in DrawElements(), when it's actually 80% of 58.9% spent in the gles2 lib + Nova.
Yeah, for now its easy to made a mistake, as it not that clear that its not whole real %, but one with part from another.
And probably will be worth to add to the Profiling info at end some more info like :
"draw commands per frame: XXX" , and taking XXX value from getting final numbers of glDrawArrays + glDrawElements + any_other glDrawXXX and divided on number of aglSwapBuffers calls.
1) tracing vs. profiling: need to improve that bit 2) unfreed signals should be fixed 3) I thought about ghosting the buttons but didn't do anything yet
I try to fix the remaining things, if you don't see any progress then create all the needed tickets.
@Hans
- added draw calls / frame. TODO: add also draw calls / second - added relative % - TODO: number of primitives
@Capehill Thanks ! Tested latest build, and there is example how it all looks like now (STK, playing one track):
OpenGL ES 2.0 profiling results for Shell Process 'supertuxkart_gl4es_1915':

--------------------------------------------------------

Total recorded duration 47195.816137 ms, 46.94 % of total context life-time 100551.372218 ms

Drawcalls (glDraw*) per frame 565.925512

Frames (buffer swaps) per second 16.110000

-> DrawElements callcount 62262, duration 23267.922445 milliseconds, 49.30 % of recorded time (23.14 % of total context life-time)

-> DrawArrays callcount 849444, duration 19443.886474 milliseconds, 41.20 % of recorded time (19.34 % of total context life-time)

-> Clear callcount 6697, duration 1674.416850 milliseconds, 3.55 % of recorded time (1.67 % of total context life-time)

-> CompileShader callcount 36, duration 1211.990055 milliseconds, 2.57 % of recorded time (1.21 % of total context life-time)

-> VertexAttribPointer callcount 2792074, duration 781.801620 milliseconds, 1.66 % of recorded time (0.78 % of total context life-time)

-> TexImage2D callcount 1256, duration 371.775033 milliseconds, 0.79 % of recorded time (0.37 % of total context life-time)

-> UseProgram callcount 40110, duration 316.792758 milliseconds, 0.67 % of recorded time (0.32 % of total context life-time)

-> BindTexture callcount 46597, duration 67.699122 milliseconds, 0.14 % of recorded time (0.07 % of total context life-time)

-> SwapBuffers callcount 1611, duration 50.966556 milliseconds, 0.11 % of recorded time (0.05 % of total context life-time)

-> EnableVertexAttribArray callcount 27326, duration 4.514256 milliseconds, 0.01 % of recorded time (0.00 % of total context life-time)

-> GenTextures callcount 142, duration 2.333761 milliseconds, 0.00 % of recorded time (0.00 % of total context life-time)

-> DeleteTextures callcount 142, duration 1.032843 milliseconds, 0.00 % of recorded time (0.00 % of total context life-time)

-> TexParameteri callcount 426, duration 0.429242 milliseconds, 0.00 % of recorded time (0.00 % of total context life-time)

-> ShaderSource callcount 36, duration 0.255123 milliseconds, 0.00 % of recorded time (0.00 % of total context life-time)

--------------------------------------------------------


Warp3D Nova profiling results for Shell Process 'supertuxkart_gl4es_1915':

--------------------------------------------------------

Total recorded duration 29230.469784 ms, 29.50 % of total context life-time 99092.776356 ms

-> BufferUnlock callcount 988562, duration 11852.596824 milliseconds, 40.55 % of recorded time (11.96 % of total context life-time)

-> DrawArrays callcount 849444, duration 5851.102619 milliseconds, 20.02 % of recorded time (5.90 % of total context life-time)

-> DrawElements callcount 62262, duration 4598.397843 milliseconds, 15.73 % of recorded time (4.64 % of total context life-time)

-> Submit callcount 102350, duration 2036.381602 milliseconds, 6.97 % of recorded time (2.06 % of total context life-time)

-> Clear callcount 6697, duration 1583.779083 milliseconds, 5.42 % of recorded time (1.60 % of total context life-time)

-> CompileShader callcount 36, duration 1111.113967 milliseconds, 3.80 % of recorded time (1.12 % of total context life-time)

-> VBOSetArray callcount 2927999, duration 906.110158 milliseconds, 3.10 % of recorded time (0.91 % of total context life-time)

-> VBOLock callcount 935958, duration 849.793359 milliseconds, 2.91 % of recorded time (0.86 % of total context life-time)

-> CreateVertexBufferObject callcount 858, duration 203.448530 milliseconds, 0.70 % of recorded time (0.21 % of total context life-time)

-> BindVertexAttribArray callcount 2897608, duration 144.847536 milliseconds, 0.50 % of recorded time (0.15 % of total context life-time)

-> DestroyVertexBufferObject callcount 858, duration 75.912419 milliseconds, 0.26 % of recorded time (0.08 % of total context life-time)

-> BindTexture callcount 51488, duration 8.746882 milliseconds, 0.03 % of recorded time (0.01 % of total context life-time)

-> SetShaderPipeline callcount 40111, duration 4.861852 milliseconds, 0.02 % of recorded time (0.00 % of total context life-time)

-> Destroy callcount 1, duration 3.291454 milliseconds, 0.01 % of recorded time (0.00 % of total context life-time)

-> FBBindBuffer callcount 2, duration 0.064563 milliseconds, 0.00 % of recorded time (0.00 % of total context life-time)

-> DestroyFrameBuffer callcount 2, duration 0.017965 milliseconds, 0.00 % of recorded time (0.00 % of total context life-time)

-> CreateFrameBuffer callcount 1, duration 0.002727 milliseconds, 0.00 % of recorded time (0.00 % of total context life-time)

-> SetRenderTarget callcount 2, duration 0.000401 milliseconds, 0.00 % of recorded time (0.00 % of total context life-time)

--------------------------------------------------------
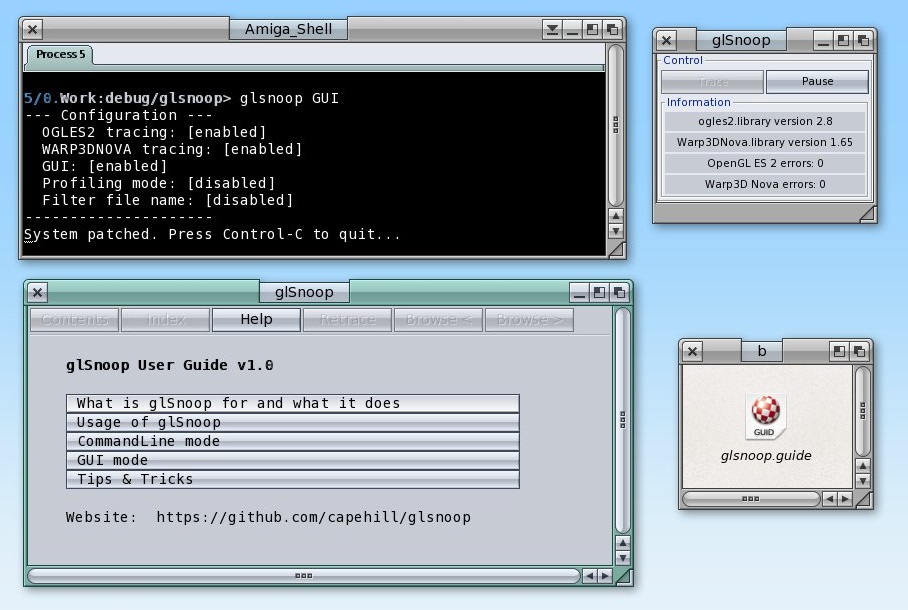
@Capehill Do you think its worth for making a little .guide ? (press open image in another tab for fullsize):
I almost finish some initial version and can upload it, so you can add it and improve when/if need it (and fixing broken english:) ). If you find it interesting/good to have of course.
ps. seeing new logs, maybe it worth to replace everywhere "milliseconds" words, on "ms" , so to short the logs for better look ?
Also i see you fix the way how output writen in terms of profiling just by saying tracing disabled/enabled , that way good too for sure, so we can close another ticket then, thanks !
Btw, didn't see that neverball showing that compileshader() take all time, that ok, as it i just run neverball (so it compile all the shaders), and then exit immediately, so mostly compileshader() and draw menu action happens.
ps. and new "primitive statistics" looks nice too :)
@Capehill Is it possible also to add "pause" support for Profiling as well ? The scenario with which i meet now are : in foobillard++, i found some slow part (when you play in game, press on some gadget at right, to bring another transparent menu), and that menu arise not very fast.
So it will be good if you run "glsnoop GUI PROFILE", hit pause, then go to problematic place, tick "trace" , then doing things which you need to profile, hit pause again and/or exit, so to have profiling info only for problematic part (to see what functions it use, what primitives, etc).
Primitive statistics (raw vertex counts): Triangles 1448700, per second 263966.961339, per draw call 204.013519 Triangle strips 26004, per second 4738.176891, per draw call 3.662019 Points 15200, per second 2769.585016, per draw call 2.140544
Hmmm. Statistics for the different primitives is probably not that useful, and even a bit misleading. Rendering is a mix of primitive types, none of those individual numbers give a true idea of performance. Triangle-strips can be made up of many triangles, and it's the number of individual triangles/primitives that matter.
Maybe sticking to the total number of vertices would be easiest (incl. vertices/s and vertices/call).
@Hans From another side that info about diffrent primitivies can help as well in understanding why something slow , for example, if you will see a loooot of points / lines, rendering of which ones are not accelerated i do not remember (if currently any).
I remember some for sure was slow, it was points or lines. And if in profiling info you see for example that everything is points and lines, then game done bad by itself.
@Capehill Can you also explain a bit how currently all patching done (and for ogles2 and for warp3dnova), i need that to put to guide, and in general i looses a bit since it was SetMethod which fail, but then i still see SetMethod in sources. Is it was SetMethod for warp3dnova and something else for ogles2,right ?
OGLES2: glSnoop patches IExec GetInterface and DropInterface using SetMethod, in order to detect applications who ask for IOGLES2 interface. Then the interface-specific OGLES2 functions get also patched using SetMethod. https://github.com/capehill/glsnoop/bl ... ster/ogles2_module.c#L278
In meantime tested latest version, yeah, all better:
Warp3D Nova profiling results for Shell Process 'foobillardplus':

--------------------------------------------------------

Function calls used 9174.493283 ms, 41.25 % of context life-time 22242.865060 ms

Draw calls per second 3248.927183

                      function | call count |     errors |        duration (ms) |   % of combined time |                  % of CPU time

                  BufferUnlock |     129968 |          0 |          2983.037294 |                32.51 |                          13.41

                 CompileShader |         32 |          0 |          2559.065445 |                27.89 |                          11.51

                  DrawElements |      26439 |          0 |          1327.010547 |                14.46 |                           5.97

                    DrawArrays |      45825 |          0 |          1043.385211 |                11.37 |                           4.69

                        Submit |      39455 |          1 |           474.698360 |                 5.17 |                           2.13

                         Clear |        729 |          0 |           447.556402 |                 4.88 |                           2.01

                       VBOLock |      72984 |          0 |           119.717648 |                 1.30 |                           0.54

      CreateVertexBufferObject |        473 |          0 |            82.958455 |                 0.90 |                           0.37

                   VBOSetArray |     196763 |          0 |            72.261940 |                 0.79 |                           0.32

     DestroyVertexBufferObject |        473 |          0 |            30.435898 |                 0.33 |                           0.14

                      WaitDone |       4057 |          0 |            17.755023 |                 0.19 |                           0.08

         BindVertexAttribArray |     193891 |          0 |             8.908169 |                 0.10 |                           0.04

                   BindTexture |      27204 |          0 |             4.622288 |                 0.05 |                           0.02

                       Destroy |          1 |          0 |             1.957252 |                 0.02 |                           0.01

             SetShaderPipeline |       9544 |          0 |             0.951237 |                 0.01 |                           0.00

                  FBBindBuffer |          4 |          0 |             0.125998 |                 0.00 |                           0.00

                      WaitIdle |          5 |          0 |             0.023219 |                 0.00 |                           0.00

            DestroyFrameBuffer |          2 |          0 |             0.019650 |                 0.00 |                           0.00

             CreateFrameBuffer |          1 |          0 |             0.002807 |                 0.00 |                           0.00

               SetRenderTarget |          2 |          0 |             0.000441 |                 0.00 |                           0.00

Primitive statistics (in vertices):

  Total vertices 37953486, per second 1706356.033052, per draw call 525.205995

  Triangles 37650708, per second 1692743.395020, per draw call 521.016108

  Triangle strips 173264, per second 7789.800170, per draw call 2.397653

  Triangle fans 121804, per second 5476.202904, per draw call 1.685542

  Lines 7710, per second 346.634958, per draw call 0.106692

--------------------------------------------------------


OpenGL ES 2.0 profiling results for Shell Process 'foobillardplus':

--------------------------------------------------------

Function calls used 13195.615431 ms, 55.10 % of context life-time 23949.303124 ms

Draw calls (glDraw*) per frame 198.527473. Draw calls per second 3017.434309

Frames (buffer swaps) per second 15.199077

                      function | call count |     errors |        duration (ms) |   % of combined time |   % of CPU time (incl. driver)

                  DrawElements |      26439 |          0 |          7637.273208 |                57.88 |                          31.89

                 CompileShader |         32 |          0 |          2700.476481 |                20.46 |                          11.28

                    DrawArrays |      45825 |          0 |          1912.058066 |                14.49 |                           7.98

                         Clear |        729 |          0 |           454.487067 |                 3.44 |                           1.90

                    TexImage2D |       2045 |        672 |           338.288567 |                 2.56 |                           1.41

                    UseProgram |       9543 |          0 |            66.933833 |                 0.51 |                           0.28

                   SwapBuffers |        364 |          0 |            26.043911 |                 0.20 |                           0.11

                   BindTexture |      31254 |          0 |            24.726150 |                 0.19 |                           0.10

                 TexSubImage2D |         85 |          0 |            15.896619 |                 0.12 |                           0.07

           VertexAttribPointer |      96897 |          0 |            14.332839 |                 0.11 |                           0.06

                   GenTextures |        167 |          0 |             2.407266 |                 0.02 |                           0.01

                DeleteTextures |        167 |          0 |             1.297871 |                 0.01 |                           0.01

       EnableVertexAttribArray |       6245 |          0 |             0.618519 |                 0.00 |                           0.00

                 TexParameteri |        333 |          0 |             0.470746 |                 0.00 |                           0.00

                  ShaderSource |         32 |          0 |             0.280306 |                 0.00 |                           0.00

                 ActiveTexture |        174 |          0 |             0.023980 |                 0.00 |                           0.00

Primitive statistics (in vertices):

  Total vertices 37953486, per second 1584774.587849, per draw call 525.205995

  Triangles 37650708, per second 1572131.878819, per draw call 521.016108

  Triangle strips 173264, per second 7234.760575, per draw call 2.397653

  Triangle fans 121804, per second 5086.011965, per draw call 1.685542

  Lines 7710, per second 321.936490, per draw call 0.106692

--------------------------------------------------------
Through a bit still messed with all those %..
Did the field " % of CPU time (incl. driver) " in ogles2 driver, mean " % of CPU time (incl. Warp3DNOVA times)" ?
And what differences between "combined time" and "of CPU time" ? I.e. what combined ?:)
I do not know, but maybe we need to substract those fields for ogles2 , (i.e. take ogles2 profiling results, substract warp3dnova , so to have only ogles2 only profile).
Like , in example above, BufferUnlock for warp3dnova take 13.41% of cpu time, and ogles2 will be 31.89 - 13.41 = 18.48. Which is true then.
But that only imho of course, for better understanding..
Did the field " % of CPU time (incl. driver) " in ogles2 driver, mean " % of CPU time (incl. Warp3DNOVA times)" ?
Yes, driver == Nova.
Quote:
And what differences between "combined time" and "of CPU time" ? I.e. what combined ?:)
I have trouble formulating it, but by "combined time" I mean the whole column: if you sum the rows, you should get 100%. BufferUnlock took 1/3 (33%) of time accumulated by all known Nova functions. Maybe I replace column header with time value (9174 ms)?
If you sum the "CPU time" column, you should get 41 % (9174/22242).
Quote:
I do not know, but maybe we need to substract those fields for ogles2 , (i.e. take ogles2 profiling results, substract warp3dnova , so to have only ogles2 only profile).
It sounds difficult. There isn't 1:1 relationship between OGLES2 and Nova. Also the context data is not aware of each other. Maybe it's technically possible by using some temp counter initiated by OGLES2 wrapper, written by Nova wrapper and read again by OGLES2 wrapper but as long as every function is not wrapped, it wouldn't be correct, I guess.
OpenGL ES 2.0 profiling results for Shell Process 'neverball':
Function calls used 9891.772587 ms, 66.09 % of context life-time 14966.655732 ms
Draw calls (glDraw*) per frame 207.984683. Draw calls per second 6350.844670
Frames (buffer swaps) per second 30.535156
function | call count | errors | duration (ms) | % of 9891.772587 ms | % of CPU time (incl. driver)
CompileShader | 54 | 0 | 4427.655692 | 44.76 | 29.58
DrawElements | 31774 | 0 | 2852.008381 | 28.83 | 19.06
DrawArrays | 63275 | 0 | 2278.488471 | 23.03 | 15.22
TexImage2D | 284 | 0 | 103.638730 | 1.05 | 0.69
Clear | 458 | 0 | 97.271364 | 0.98 | 0.65
UseProgram | 10210 | 0 | 79.046758 | 0.80 | 0.53
BindTexture | 27422 | 0 | 21.728756 | 0.22 | 0.15
SwapBuffers | 457 | 0 | 12.847857 | 0.13 | 0.09
VertexAttribPointer | 93175 | 0 | 11.570117 | 0.12 | 0.08
GenTextures | 284 | 0 | 3.310101 | 0.03 | 0.02
DeleteTextures | 284 | 0 | 2.304969 | 0.02 | 0.02
ActiveTexture | 7164 | 0 | 0.543369 | 0.01 | 0.00
EnableVertexAttribArray | 5100 | 0 | 0.520752 | 0.01 | 0.00
ShaderSource | 54 | 0 | 0.446004 | 0.00 | 0.00
TexParameteri | 921 | 0 | 0.391266 | 0.00 | 0.00
Primitive statistics:
Total vertices 18135608, per second 1211758.455109, per draw call 190.802723, consisting of:
- Triangles 17629044, per second 1177911.604756, per draw call 185.473219
- Triangle strips 395172, per second 26404.023081, per draw call 4.157561
- Points 111392, per second 7442.827273, per draw call 1.17194
And profiling stop/pause works too. Through, at first run i was a bit stack when run "glsnoop GUI PROFILE", as tracing was ghosted (that ok) with buttons "trace/pause", but profiling have "start/finish", so that "finish" a bit make me think for few seconds before i got that i need on running press finish, then found place to check, and press "start" again. And then all works, yeeah ! :))
If you doens't mind, i can tomorrow upload glsnoop.guide, you can correct it as you think it worth and for 0.2 release its already fat enough by new features and co :)
Some parts just taken from your simple readme (so that to be writen later with all explaining and stuff). Some parts like GUI mode and Q/A are "N/A" at moment but for 0.2 release can fits. Rewrite it of course as you think is need it to be, or remove things which you think not need it there, while i can add some bits in meantime: at least i thinking about putting to profile section example of profiling with describing all fields, as well as the same for tracing field, with example output with describing things a little too, but that can go for 0.3
Btw, " duration (ms)" in ogles2 profiling, also mean " duration (ms) including Warp3DNova times".
Maybe need to be changed somehow output there to point that all % and ms mean include warp3dnova times, not only CPU time
Cool, thanks. I will add it to repo soon. Maybe a link to Sashimi tool can be added for completeness.
Yes, you are correct, OGLES2 times include Nova times. Maybe it should be removed from table, making columns slimmer. It could be added on a separate line for clarity.
There could also be "calls/s" or "call average duration" column. I think MiniGL profiler has something like that.
Then, I guess 0.2 would be ready.
(BTW: I have occasional WinFrame DSIs when I scroll around in console, for example after Sashimi logging or some long compilation, should report to OS4 devs. I think the problem is triggered by lots of content on console)
(BTW: I have occasional WinFrame DSIs when I scroll around in console, for example after Sashimi logging or some long compilation, should report to OS4 devs. I think the problem is triggered by lots of content on console)
Yeah, quite rare but i have some winframe DSIs too, through not in case with sashimi and glsnoop, but when there is some heavy big output coming from something (like when you compile some big stuff).
I report it back in past to Tony, as well , as i report him that current console bring a lot of memguards HITS, on which he say that he start to rewrite it all, so i didn't bother reporting futher.
Quote:
Yes, you are correct, OGLES2 times include Nova times. Maybe it should be removed from table, making columns slimmer. It could be added on a separate line for clarity.
Probabaly not need to remove, because, its quite usefull to see how much exactly take nova and ogles2 when doing operation. Or you mean remove from last field that (incl. driver time) words, and put it at top of table, like all 3 last fields incl. driver time ?
Maybe there should be just 3st table maybe, of ogles2 without including warp3dnova times, but that will probabaly mess the things .. And have 3 tables sure will be more messy if just clarify things as you say..